Posts

Showing posts from 2016

VMware vROps - What's new in vROps 6.4?

Image
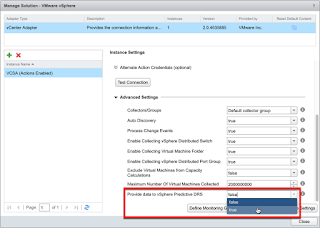
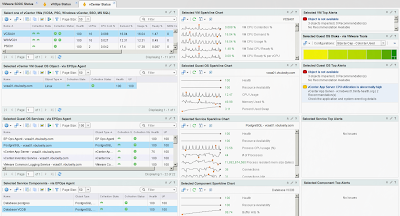
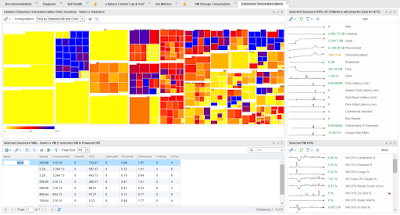
VMware announced the release of vRealize Operations Manager (vROps) 6.4. This update includes the usual stability and usability  improvements along with support for vSphere 6.5, as well as introduction of Predictive DRS (pDRS) for Workload Placement (WLP). pDRS is in technical preview until vROps 6.5 is released in 17Q1. On top of that, j ust like vROps 6.3 before it, vROps 6.4 comes with more new Custom Dashboards OOTB.  So without further adieu, l et's take a closer look at all the goodies.

VMware vROps - Exposing and Reporting on VM Custom Profiles with API and Super Metrics

Image
Since the introduction of Custom Profiles in vROps 6.1, VMware has given customers the ability to define their own custom VM sizes for capacity planning purposes. This is a very handy feature when performing capacity analysis  using the canned Analysis > Capacity Remaining dashboard on the vSphere Cluster level. However, there is no way to access these custom profile metrics through any of the metric pickers so they cannot be added to custom dashboards or reports. API and Super Metrics to the rescue. In this post we will cover how to access and expose the custom profile metrics to the GUI so they can be easily leveraged throughout the product's various visual elements. I had many customers ask for this in the past so figured it's time to let the cat out of the bag and let the world know.

VMware vROps - A closer look at what's new in vROps 6.3

Image
Without much fanfare, VMware released vRealize Operations Manager (vROps) 6.3 right before  VMworld 2016 . vROps is VMware's popular Cloud and Software Defined Datacenter (SDDC) monitoring and analytics solution. Besides the usual  enhancements to most features including c onfiguration, licensing, alerting, reports, policies as well as introducing some new dashboards and widgets, this release is jampacked with hidden gems all over the place.  A number of bug fixes were also included. This post will elaborate on some of the new features and enhancements beyond what was provided in the press release. So read on because there are some cool things that VMware omitted from the official release materials that are well worth you time.

VMware vROps - Compare Multiple VMs Dashboard

Image
A customer recently asked if it was possible to compare the same metric from multiple VMs in a single dashboard. Yes it is, and here is how it's done and what such a dashboard may look like. This type of dashboard is very useful if you want to evaluate and compare performance of several VMs carrying out the same or similar work. For example, it could include a number of load balanced web front-ends or some other VMs hosting a number of different enterprise applications. It can also be used to compare how similar VMs perform on different vSphere Hosts running on different generation hardware. Of course the same concept can be applied to comparing different vSphere Hosts or Datastores themselves.

VMware vROps - EPOps Multi-vCenter Monitoring Dashboard

Image
Since the  EPOps vCenter Monitoring Dashboard is one of the most popular posts on the blog, I thought it would be a good idea to update this highly demanded dashboard to work with multiple vCenters. A lot of sizable enterprises out there have multiple vCenter instances with thousands of hosts and tens of thousands of VMs. Also, with the introduction of vSphere 6, more customers have begun their migration journey away from Windows-based vCenter servers to vCenter Server Appliance (VCSA) and everything in-between, including a mix of both solutions.  Since vROps enables you to have a unified single pane of glass view across your entire environment regardless of locations or versions, you can leverage it to create a dashboard to keep an eye on all of your vCenter servers. This can include both Windows and VCSA versions of vCenter, as well as SSO and PSC if they have been separated out. Heck, you can even include the MS SQL server hosting the vCenter database if you want.

VMware vROps - vROps Self-Monitoring Alerts and Notifications

Image
As I mentioned in my previous vROps Self-Monitoring Dashboard  post, you need a way to get notified when vROps self-monitoring alerts get triggered. This way you don't have to keep staring at the dashboard all day and can rest assured that if something goes awry you will find out. Even though vROps is deployed as a Virtual Appliance (VA) in most environments, it is important to remember that under the hood it is still just another application with services running in an Operating System. Therefore, just like any other application, it is susceptible to failure at some point.  In this post, I will go over how to setup simple email notifications for  vROps self-monitoring alerts if there is an issue with one of the vROps objects such as Cluster, Nodes, or one of the application services.

VMware vROps - "Monitor the Monitor" Dashboard

Image
While working with vROps over the past year or so, I have had quite a few customers ask for a "Monitor the Monitor" type dashboard. I thought about it and decided that this would not only come in handy when trying to keep an eye on the vROps' health, but also provide some basic capacity and performance stats. The capacity part of this dashboard could be especially useful when planning an analytics cluster upgrade or when adding a significant number of new objects and metrics to monitor, empowering you to make more educated scaling decisions. (See my previous posts " When and how to scale your monitoring solution? " about resizing your vROps Analytics Cluster to meet the needs of your growing environment.)  Normally, all this info has to be gathered from several places within the product, which may be too overwhelming for a casual product user. So, the goal of this dashboard is to provide all of the useful nuggets of information in a single pane of glass.

VMware vROps - Custom Dashboard Design Part 2

Image
This is part 2 of the  Custom Dashboard Design post from couple weeks ago. As promised in part 1, we will take a stab at adding more complications to our basic DIY dashboard design. Our focus will be on adding more widgets and creating more sophisticated interactions. So, l ike a fine swiss watchmaker, we will refine our plain dial with additional subdials and apertures giving our users more subtle functionality.

VMware vROps - Custom Dashboard Design Part 1

Image
I think that Custom Dashboards are one of the most powerful features in vRealize Operations Manager (vROps). They enable you to commission and build compelling frames of view, almost like paintings, into your virtual or cloud environment. These dynamic paintings can tell the user a story and empower them to make educated decisions about many facets of a Software Defined Data Center. So, you want to start building your own Custom Dashboard in vROps but don't know where to start. Do custom dashboards seem a little overwhelming and a bit like black magic? Well, maybe a little, but with understanding of some basic concepts, I will try to demystify this artform and make you a dashboard ninja in no time. To get you started, we will begin with a very simple but somewhat powerful dashboard, build on it to add more functionality, and finally move on to some more complex use cases. Hopefully by the end of this series, you will be able to dream up your own dashboards and impress everyo

Honored to be awarded VMware vExpert 2016!

Image
I'm humbled and honored to be selected for the VMware vExpert 2016 Award. Thank you everyone for reading my blog! The VMware vExpert program is VMware's global evangelism and advocacy program. The award is for individuals, not companies or VMware employees, who have significantly contributed to the community of VMware users over the past year. The VMware vExpert title is awarded on an annual basis to individuals for their commitment to sharing their knowledge and passion for VMware technology, above and beyond their job responsibilities. Announcement: http://blogs.vmware.com/vmtn/2016/02/vexpert-2016-award-announcement.html  vExpert Directory:   https://communities.vmware.com/vexpert.jspa   Other Resources: https://communities.vmware.com/community/vmtn/vexpert 

VMware vROps - vRealize Operations Manager 6.2 Released

Image
VMware just released a new update to its popular cloud operations management and monitoring suite.  vRealize Operations Manager 6.2 is the newest release of the VMware's integrated vRealize Operations Suite in the SDDC family. Updates address all major features of the product including installation, configuration, licensing, alerting, dashboards, reports, policies as well as introducing some new enhancements.

VMware vROps - VM Storage Consumption Dashboard

Image
As mentioned in my Datastore Oversubscription Dashboard post, here is the VM Storage Consumption Dashboard. It appears very similar to the oversubscription one but it looks at storage use from another perspective. Mainly, it shows who/which VMs are the biggest consumers of storage resources. In addition, we can also see how much of the allocated storage space the VMs are actually utilizing, and if the Guest OS partitions are filling up, provided that VMware Tools are installed and running. Besides the visuals, we have some overall environment storage utilization stats, followed by cluster and VM.

VMware vROps - To HA or not to HA?

Image
A lot of my clients want to deploy vROps with High Availability (HA) option enabled. When I hear this, I simply ask them to name at least one business requirement that dictates the use of HA for vROps in their environment. The answer I typically get is something like this: "because we want HA" with some undertones of: how dare you ask, you should know we're a very important company! Well, working as a vROps consultant over the last year, I realized that there are a lot of misconceptions about the vROps HA feature. In this post, I would like to clarify some things about vROps HA and hopefully empower you to make the right decision when designing your vSphere monitoring solution.

VMware vROps - When and how to scale your monitoring solution?

Image
There has been a lot of hype surrounding the new scale-out vROps architecture, which enables you to easily add more nodes to vROps analytics cluster as needed. However, is scale-out always the right choice? Sometimes, a scale-up option may be better suited depending on what shortfall you are trying to address. In this post, we will go through some common scenarios that will help you make the right decision for your environment and hopefully make this process more of a science than an art.

VMware vROps - Datastore Oversubscription Dashboard

Image
A customer recently challenged me to create a Datastore dashboard showing how oversubscribed their thin provisioned vSphere Datastores are. This was a twist on my VM Storage Consumption dashboard that I have been doing for a while and will post next time. The goal of this new dashboard is to visualize the Datastore subscription rate of the thin provisioned Datastores in the virtual environment. In addition, it can show impacted virtual machines as well as some additional storage-related key performance indicators.