VMware vROps - Compare Multiple VMs Dashboard
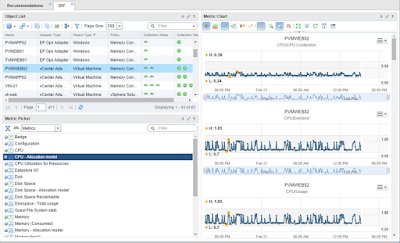
A customer recently asked if it was possible to compare the same metric from multiple VMs in a single dashboard. Yes it is, and here is how it's done and what such a dashboard may look like. This type of dashboard is very useful if you want to evaluate and compare performance of several VMs carrying out the same or similar work. For example, it could include a number of load balanced web front-ends or some other VMs hosting a number of different enterprise applications. It can also be used to compare how similar VMs perform on different vSphere Hosts running on different generation hardware. Of course the same concept can be applied to comparing different vSphere Hosts or Datastores themselves.
So without further ado let's break down the various components and functionality of this simple yet powerful dashboard.
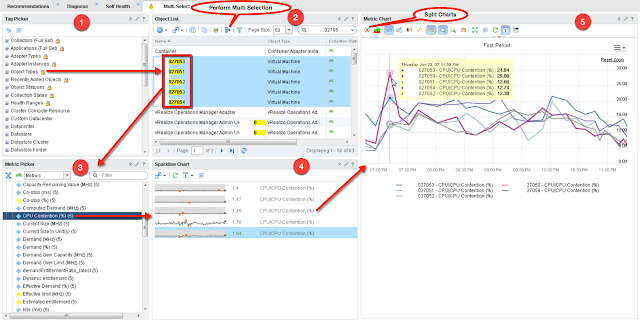
 In the top left corner of the Content Pane is a Tag Picker widget (1). The purpose of it is to allow us to select Object Types that then get displayed in the Object List widget (2). This provides some filtering abilities, and enables us to cut down on the number of objects displayed and focus on a single type of resource such as Virtual Machines, Datastores, vSphere Hosts, or Clusters.
Once we have a list of all VMs in the environment, it is time to use the Object List filter to hone in on the specific set of VMs we want to compare. Type the partial name of the VMs you are after in the filter and hit enter to further narrow down the list. You want to get as close to the exact name as possible but still leave some room for variation to catch all VMs you want to analyze. If you have a lot of VMs, you may still have to scroll through to find the ones you are looking for.
When you have located the VMs, Control+Click each VM to select them. With the selections made, click the Perform Multi Selection button on the Object List widget toolbar. This action will load the selected VMs into the Metric Picker widget (3). (Notice that the metric picker reloads after you click the selection button in the object list and a number is displayed in parenthesis next to the metric name, indicating how many objects were selected.) Now that we have loaded our VMs into metric picker, it is time to decide which metrics you want to compare. As always, this requires some background knowledge of virtualization, but you can go exploring on your own.
Moving on with our example, we selected CPU Contention % and once we double-click on this specific metric, a set of sparklines will be added to the Sparkline Chart widget (4) at the bottom of the center column. Now that we have our metric in the sparkline chart, we can click on each to add it to the Metric Chart widget (5). In the metric chart, we can easily preview, zoom in or out, and look at the longer historical trend of the individual charts. Most importantly, we can use the Split Charts button to overlay all selected charts on a single axis to compare the metrics side-by-side. You can find more details on how to use the Metric Chart widget toolbar in my previous blog post on basic dashboard design.
To the left are the Widget Interactions needed to make this work. Also, to prevent both Sparkline Chart and Metric Chart widgets from loading a bunch of random badge metrics, I use a blank XML Interaction File in the widget Metric Configuration to prevent them from getting cluttered when I use the dashboard.
Here is the simple code of the blank XML Interaction File; there really is not much to it:
<?xml version="1.0" encoding="UTF-8" standalone="yes"?>
<AdapterKinds>
<AdapterKind adapterKindKey="VMWARE">
<ResourceKind resourceKindKey="VirtualMachine">
</ResourceKind>
</AdapterKind>
</AdapterKinds>
I hope you find this dashboard useful while troubleshooting or during performance analysis. Enjoy!
For more information about vROps, see the following resources:
vROps Extensibility Options:
You can extend vROps functionality by installing additional management packs:
VMware Management Packs include options for vRA, NSX, vRO, Log Insight, AWS, etc.
Blue Medora Management Packs include options for NetApp, Oracle, SAP, UCS, Citrix, etc.
Books:
VMware Performance and Capacity Management - Second Edition by Iwan 'e1' Rahabok
VMware vRealize Operations Managers Essentials by Matthew Steiner
Mastering vRealize Operations Manager by Scott Norris
VMware vRealize Operations Manager Capacity and Performance Management by Iwan 'e1' Rahabok
Official VMware:
VMware Professional Services
Official vROps Documentation
VMware Operations Management White Papers
vROps product page
Blogs:
VMignite by Lan Nguyen
vXpress by @Sunny_Dua
virtual red dot by @e1_ang
Virtualise Me by @auScottNorris
Elastic Sky Labs by @JAGaudreau
i'm all vIRTUAL by @LiorKamrat
So without further ado let's break down the various components and functionality of this simple yet powerful dashboard.
 In the top left corner of the Content Pane is a Tag Picker widget (1). The purpose of it is to allow us to select Object Types that then get displayed in the Object List widget (2). This provides some filtering abilities, and enables us to cut down on the number of objects displayed and focus on a single type of resource such as Virtual Machines, Datastores, vSphere Hosts, or Clusters.
Once we have a list of all VMs in the environment, it is time to use the Object List filter to hone in on the specific set of VMs we want to compare. Type the partial name of the VMs you are after in the filter and hit enter to further narrow down the list. You want to get as close to the exact name as possible but still leave some room for variation to catch all VMs you want to analyze. If you have a lot of VMs, you may still have to scroll through to find the ones you are looking for.
When you have located the VMs, Control+Click each VM to select them. With the selections made, click the Perform Multi Selection button on the Object List widget toolbar. This action will load the selected VMs into the Metric Picker widget (3). (Notice that the metric picker reloads after you click the selection button in the object list and a number is displayed in parenthesis next to the metric name, indicating how many objects were selected.) Now that we have loaded our VMs into metric picker, it is time to decide which metrics you want to compare. As always, this requires some background knowledge of virtualization, but you can go exploring on your own.
Moving on with our example, we selected CPU Contention % and once we double-click on this specific metric, a set of sparklines will be added to the Sparkline Chart widget (4) at the bottom of the center column. Now that we have our metric in the sparkline chart, we can click on each to add it to the Metric Chart widget (5). In the metric chart, we can easily preview, zoom in or out, and look at the longer historical trend of the individual charts. Most importantly, we can use the Split Charts button to overlay all selected charts on a single axis to compare the metrics side-by-side. You can find more details on how to use the Metric Chart widget toolbar in my previous blog post on basic dashboard design.
To the left are the Widget Interactions needed to make this work. Also, to prevent both Sparkline Chart and Metric Chart widgets from loading a bunch of random badge metrics, I use a blank XML Interaction File in the widget Metric Configuration to prevent them from getting cluttered when I use the dashboard.
Here is the simple code of the blank XML Interaction File; there really is not much to it:
<?xml version="1.0" encoding="UTF-8" standalone="yes"?>
<AdapterKinds>
<AdapterKind adapterKindKey="VMWARE">
<ResourceKind resourceKindKey="VirtualMachine">
</ResourceKind>
</AdapterKind>
</AdapterKinds>
I hope you find this dashboard useful while troubleshooting or during performance analysis. Enjoy!
For more information about vROps, see the following resources:
vROps Extensibility Options:
You can extend vROps functionality by installing additional management packs:
VMware Management Packs include options for vRA, NSX, vRO, Log Insight, AWS, etc.
Blue Medora Management Packs include options for NetApp, Oracle, SAP, UCS, Citrix, etc.
Books:
VMware Performance and Capacity Management - Second Edition by Iwan 'e1' Rahabok
VMware vRealize Operations Managers Essentials by Matthew Steiner
Mastering vRealize Operations Manager by Scott Norris
VMware vRealize Operations Manager Capacity and Performance Management by Iwan 'e1' Rahabok
Official VMware:
VMware Professional Services
Official vROps Documentation
VMware Operations Management White Papers
vROps product page
Blogs:
VMignite by Lan Nguyen
vXpress by @Sunny_Dua
virtual red dot by @e1_ang
Virtualise Me by @auScottNorris
Elastic Sky Labs by @JAGaudreau
i'm all vIRTUAL by @LiorKamrat


Comments
Post a Comment