VMware vROps - A closer look at what's new in vROps 6.3

New Canned Dashboards
Finally, a number of new canned Dashboards have been included with this release. This is in an effort to provide monitoring for the VMware's SDDC stack. Again, just like with the canned vSphere Dashboards, your mileage may vary due to the lowest common denominator that these are designed for. Usually, things get vastly more complex in large environments with multiple vCenters and SDDC stacks, and this is where PSO can be indispensable in designing dashboards tailored towards real-world scenarios in your environment.
All new Home landing page with Alerts and Recommended Actions
vROps 6.3 introduces a new highly interactive Home dashboard with a Recommended Actions widget. This is a fantastic way to slice and dice your environment by different resource kinds (object types) and focus on important alerts. You can filter by vCenter, Cluster, Hosts, VMs, or Datastores, as well as Health, Risk, Efficiency, and Alert Criticality. You can also trigger VM remedial actions right from this dashboard itself without going to vCenter. So this is much more than just a cosmetic change, this dashboard should be a workhorse for any support and ops team.

Actions in Action
Ability to trigger actions from the Home dashboard is a great way to resolve issues without having to bounce over to vCenter. Actions will be available if the first recommendation for the alert has an action tied to it.


Configure DRS from vROps
The all-new canned vSphere DRS Cluster Settings dashboard enables you to very quickly view DRS status and empowers you to change DRS levels right from vROps. Besides DRS status and changes, you can also view selected Cluster Hosts' CPU and Memory Workload %.


Perform Actions from Workload Utilization Dashboard.
If you see out-of-balance clusters in the previous vSphere DRS Cluster Settings dashboard, you can now use the Workload Utilization dashboard with the Workload Balance widget to rebalance your workloads across different clusters. The clusters have to be in the same vCenter, have same EVC level, and shared network and storage.


New vROps Self Monitoring Dashboards
This new release includes a few vROps "Self..." dashboards that are disabled OOTB. You have to enable them to make them visible. They cover a nice variety of vROps objects and metrics. However, if you're looking for something more concise and straight to the point then see my Monitor the Monitor dashboard I've blogged about in the past.


If you're not satisfied with all the new canned dashboards you can still download more from the VMware Solutions Exchange or the unfortunate VSX acronym it goes by... These downloadable dashboards provide additional visibility into VMware's SDDC stack and include:
- SDDC Management Apps Health Overview
- SDDC Application Components Overview
- SDDC Management App Alerts

This provides a very convenient way to see the collection status from all data sources. If any adapter stops collecting data, a notification will bubble-up to the toolbar to conveniently alert the administrator that there is an issue. Very handy indeed.

Improved Log Insight Integration.
Starting with the vROps 6.3, the Management Pack for Log Insight will be included in the product OOTB. Improved Log Insight and vRealize Operations Manager integration focuses around alerting enhancements.
- Log Insight Alert Notification Notes now appear within the Notification Event in vROps
- vROps Alert Summary now includes Alert Name from Log Insight
- vROps Notification Detail includes URLs within Notes and Criticality from Log Insight Alert
- Log Insight Log Data which triggered the alert is provided in the vROps Alert Notification

Some improvements have also been made to the Alert configuration in Log Insight. All of this obviously requires version 3.6 of Log Insight which coincidentally dropped with vROps 6.3. See the announcement here.
Enhanced vSphere Monitoring and Compliance
New support for vSphere 6.0 and updated vSphere 5.5 Hardening Guides, both cover 93% and 90% respectively of available checks. The rule violations are implemented in the form of additional alerts. A new hardening report is also included. The Hardening Guides can be enabled via Policy settings. Alerts for vSphere Distributed Switch and Port Group in addition to vCenter, Host, and VM are also included now.

Updated vROps Security Guide.
If you're in a highly secure public sector environment, VMware has provided an updated Guide for deploying an managing highly secure vROps 6.3 implementations. (Download PDF here.)
New SSL Certificate Validation
vROps 6.3 now performs better certificate validation and ensures expired certs cannot be updated. The certificate handling among nodes has also been improved and you can manage everything through the API now.

As mentioned in the opening section there are a ton of new belts and whistles in the 6.3 release so read on and kudos to the product team!
New API Programming Guide.
VMware is now providing an API Programming Guide to get you started with programmatically interacting with vROps. (Download PDF here.) You can always find the Rest API online documentation by going to https://<vROpsFQDNorIP>/suite-api/docs/rest/index.html

Public CaSA API
Speaking of APIs, there is now an API for vROps Cluster management that allows you to perform actions listed blow. Full documentation can be had at: https://<vROpsFQDNorIP>/casa/api-guide.html
- Configure cluster
- Configure master node
- Configure data node
- Configure replica node
- Configure remote collector node
- Configure custom certificate
- Set administrator password
New licensing for vRealize Operations Manager Standard and Advanced Editions.
With the new release you can finally mix Standard, Advanced, and Enterprise licensing all in a single instance.

Filtered SNMP Trap Alert Notifications.
You can now filter SNMP Alert Notifications at the source by Scope, Trigger, and Criticality just like with SMTP or Rest Plugin rules. This will allow you to only push select alerts via SNMP instead of everything.

Enhanced Super Metric Capabilities.
One of my favorite features just got a boost. Super metrics now can do so much more and finally introduced support for conditional statements.

I'm working on a separate post solely about super metrics, so I'm going to go light on details here, but these are the basics. I would be doing you a disservice if I did not mention one improvement that stands out above the rest: the introduction of support for conditional statements. This is huge, and I cannot wait to come up with use cases for this!
| Operator |
Description
|
|---|---|
| + | Add |
| - | Subtract |
| * | Multiply |
| / | Divide |
| % | Modulo |
| == | Equals |
| != | Not Equals |
| < | Less than |
| <= | Less than or equals |
| > | More than |
| >= | More than or equals |
| || | Or |
| && | And |
| ! | Not |
| () | Parentheses |
| x?y:z | If X then Y else Z |
| [x,y,z] | Array containing X, Y, and Z |
| where | Where some value is true or false, must be used with logical operators such as ==, !=, >, >=, <, or <= |
Reduction in calculated metrics collected.
Version 6.3 reduces the number of calculated metrics freeing up some compute and disk resources. This is a welcome change as it will improve product's scalability and performance. The number of collected raw metrics remains unchanged for now.
New VM Metrics and Properties.
You lose some, you gain some. Not only does vROps 6.3 reduce the metric collection by skipping less popular metrics, it also gains a whole new set of metrics and properties.
New Guest OS Memory Metrics.
vROps can now collect Guest OS Memory metrics from the VMs. Essentially, this means that now you can get accurate memory usage statistics from the Guest OS. Both Windows and Linux are supported and the best part is that no EPOps Agent is required. Couple of caveats here though. This requires the VM is running on vSphere 6.0 Update 2 or later, managed by vCenter 6.0 Update 2 or later, and that VMware Tools are running and up-to-date. Obviously, vROps has to be at 6.3. One thing I would like to point out about the no EPOps Agent requirement is that this will only give you basic OS memory usage. The EPOps Agent can be much more granular and get Memory usage besides OS down to a specific application or service and process. So make sure you understand the requirements. But still, this is way better than just Active Memory or Consumed Memory which was just a synthetic algorithm. The next step will be using these new metrics in capacity calculations. Please see documentation for detailed metric descriptions.

New VM Properties.
Not as exciting as the new Guest OS Memory metrics, but still worth the mention are the new properties that show VM's parent vCenter Folder and Datastore. If the VM has VMDKs on multiple Datastores, they will be shown separated by commas. This will be handy in creating Custom Groups and other forms of filtering.

Multiple UI/UX enhancements.
A number of user interface and usability improvements have been introduced in this release. Besides two completely new widgets, some new functionality has been added to Trendline View, Heatmap, and Scoreboard widgets. Probably the most noteworthy one is the move to freestyle layout of widgets on the dashboard. This not only makes it very easy to arrange the widgets any way you like, but also enables you to resize them in new ways so you are no longer bound by the frames with columns and rows. We can now also search the widget list, making frequently used widgets easier to find.

The updated Scoreboard widget is now sporting some new and more polished themes that are smoother and easier on the eye.

Here is a comparison of the 5 available themes. Which one is your favorite? I dig Theme 4, but Theme 2 will be usefull in tight spaces.

More advanced Heatmaps widget.
The updated Heatmap gains some new tricks, including the ability to focus in on a group of objects. This will be very useful when dealing with large number of objects displayed in the widget as it will allow you to zoom on a specific subset by clicking on the legends at the bottom of the widget. The wiget will then only show objects in the selected range.


Drilldown in Trendlines View.
You can finally drill down from parent object to its children. For example, selecting a host, you can see all the VMs CPU Ready %. Here is a quick dashboard example on how to take advantage of this feature.

New Look for Forensics widget.
Besides the cosmetic changes in line thickness making things easier to read, the Forensic widget now also displays Min and Max values giving it more of a Metric Chart feel.

More Sophisticated Maintenance Scheduler.
The Maintenance Scheduler gained more flexibility in scheduling options making it more adaptable to a wider array of maintenance scenarios in the real world.

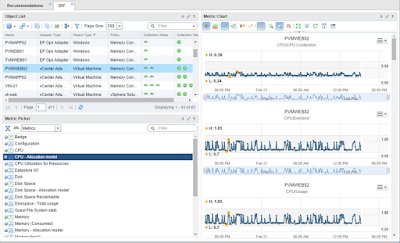
XML Interaction File Editor.
Finally, no more excuses for not creating interaction files to go with charts. With the addition of the all-new XML editor, it is almost a trivial task. All you have to do is select an Adapter, Resource Kind (Object Type), and metrics you want to add from the picker. The XML is basically built for you on the fly. Pretty sweet!

Updated vCenter Adapter Configuration in Solutions
The improved vCenter Adapter confi in solution now comines the Python Adapter config by simply enabling the vCenter Actions.

There is also a Reset Default Content button that allows you to reset all vCenter Adapter content to OOTB.

You can also redefine your monitoring goals from here and enable the Hardening Guide.

I hope this does it for now... I'm sure I'll discover more cool stuff as I work with the product over the coming months. As you can see there is a lot of new cool stuff, and I am really looking forward to exploring new possibilities, creating new dashboards, and blogging about it. Again, the product team has done a terrific job and I hope the next release will be even better. Enjoy!
Release Related Info:
VMware Blogs Release Post
Sizing Guide
Release Notes
Product Download Page
Product Marketing Page
Online Documentation Center
Downloadable Documentation
Product Interoperability Matrix
For more information about vROps, see the following resources:
vROps Extensibility Options:
You can extend vROps functionality by installing additional management packs:
VMware Management Packs include options for vRA, NSX, vRO, Log Insight, AWS, etc.
Blue Medora Management Packs include options for NetApp, Oracle, SAP, UCS, Citrix, etc.
Books:
VMware Performance and Capacity Management - Second Edition by Iwan 'e1' Rahabok
VMware vRealize Operations Managers Essentials by Matthew Steiner
Mastering vRealize Operations Manager by Scott Norris
VMware vRealize Operations Manager Capacity and Performance Management by Iwan 'e1' Rahabok
Official VMware:
VMware Professional Services
Official vROps Documentation
VMware Operations Management White Papers
vROps product page
Blogs:
VMignite by Lan Nguyen
vXpress by @Sunny_Dua
virtual red dot by @e1_ang
Virtualise Me by @auScottNorris
Elastic Sky Labs by @JAGaudreau


Comments
Post a Comment