VMware vROps - VM Storage Consumption Dashboard
OK, let's look at this dashboard in detail.

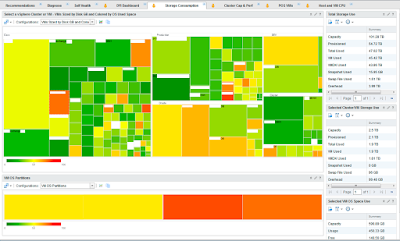
This is akin to some of those system disk utilities which display the files that take up the most space on your disk, but better because by using the heatmap widget we get to see in two dimensions. Initially, we see the total footprint of the VM's VMDK (disk) files on the Datastore and then, thanks to VMware Tools, we get to see inside the VMDK files. Being able to see inside the VMs disk files can tell us whether the allocated space is used or wasted. As far as interactions go, we have two possibilities. First, we can select an entire vSphere Cluster, and second, we can select just an individual VM. Your selection will determine how the rest of the dashboard behaves.
But, enough about our main widget, let's move on to the second Heatmap widget (2) below. This heatmap widget is set to Instance Mode in order to allow us to see all of the partitions present in the Guest OS. It works when you select a VM in the main heatmap. (Again, this requires VMware Tools to be installed and running in the VM.) Similar to the main heatmap widget, each rectangle represents the relevant size of each VM's Guest OS partition. The color, on the other hand, will indicate how full the partition is. Here again like in the main widget, the scale goes from 0 to 100 percent, indicating the partition is nearly empty when green, and filling up when red. Hovering your mouse cursor over the partition rectangle will reveal a pop-up window displaying additional info such as VM name, Guest OS partition designation, and percent of file system usage. In our example we obviously have a Windows system, but hits works for Linux as well. The interaction of these two heatmap widgets can paint a very vivid picture of your storage utilization both from the storage array and Virtual Machine perspective.
However, if the pictures don't tell the full story and you need hard numbers, we have that as well. To the right are three View Widgets showing some rolled-up storage summary breakdowns based on what is selected in the heatmap widgets. The first View widget (3) titled "Total Storage Use" is a somewhat static, meaning it does not interact with other widgets on the dashboard and always shows the same info. Now, that is not to say it does not stay up-to-date. Like anything else in vROps, it is always updated with each collection cycle. The purpose of this view widget is to illustrate a summary of all the storage allocated to the vSphere environment. There are metrics such as total capacity, provisioned, used, snapshots, etc. to give some general storage consumption info. The one caveat is that these numbers only represent storage allocated to our vSphere environment, meaning the storage array may have more capacity that has not been provisioned or was provisioned to other physical systems and we have no visibility into it. This is an obvious limitation that can be solved by using one of the available storage Management Packs (MPs), like EMC Storage Analytics (ESA) or Blue Medora's for NetApp. There are other MPs from vendors like HP for 3PAR and PureStorage. I will be posting more dashboard designs that leverage MPs in the future, but for now we're keeping things simple to what's OOTB.
Moving on, we have another View widget (4) titled "Selected Cluster/VM Storage Use" showing a storage stats summary for the selected vSphere Cluster or VM from the main Heatmap widget (1). This way we can quickly assess common metrics like total capacity, provisioned space, used space, snapshots, etc. Keep in mind that this view will dynamically display different stats depending whether you selected a cluster or VM. This brings us to the last View widget (5) that just displays the partition stats from the selected VM Guest OS.
I hope this dashboard will help you visualize and get a better handle on managing your storage. Enjoy!
For more information about vROps, see the following resources:
Books:
VMware vRealize Operations Managers Essentials by Matthew Steiner
Mastering vRealize Operations Manager by Scott NorrisVMware vRealize Operations Manager Capacity and Performance Management by Iwan 'e1' Rahabok
Official VMware:
VMware Professional Services
Official vROps Documentation
VMware Operations Management White Papers
Extensibility and Management Packs
vROps product page
Blogs:
vXpress by @Sunny_Dua
virtual red dot by @e1_ang
Virtualise Me by @auScottNorris
Elastic Sky Labs by @JAGaudreau
i'm all vIRTUAL by @LiorKamrat


This comment has been removed by the author.
ReplyDelete