VMware vROps - vSphere Cluster Capacity and Performance Dashboard Part 2 - Top Offenders

Before we get into the Top Offender dashboards, let me point out that after enabling the dashboard interaction functionality, you will see a Navigation icon in the Cluster Health Chart widget that will allow you to make a jump into one of the three Top Offenders dashboards. See example below:

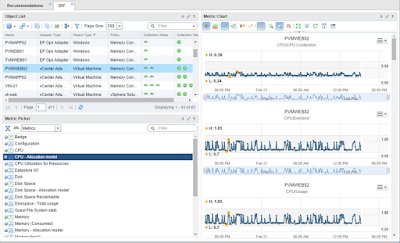
So finally, here is an example of what a Top Offenders - VMs dashboard looks like. (Host and Datastore dashboards look the same, except they show the respective metrics.)

It's basically a series of Top-N widgets configured to show top 25 VMs in each category of KPIs (CPU, memory, storage, and network). You can select a VM and click the Chart button in the toolbar, or double-click the VM in the list and vROps will take you to the Analysis OOTB dashboard for the object. As you can see, there is not much going on in this dashboard and it kind of looks boring, but today this is the best way of getting down to the objects that are impacted the most from the cluster level.
Here are the Host and Datastore versions:


Stay tuned for my next dashboard and enjoy!
For more information about vROps, see the following resources:
Books:
VMware vRealize Operations Managers Essentials by Matthew Steiner
Mastering vRealize Operations Manager by Scott NorrisVMware vRealize Operations Manager Capacity and Performance Management by Iwan 'e1' Rahabok
Official VMware:
VMware Professional Services
Official vROps Documentation
VMware Operations Management White Papers
Extensibility and Management Packs
Blogs:
vXpress by @Sunny_Dua
virtual red dot by @e1_ang
Virtualise Me by @auScottNorris
Elastic Sky Labs by @JAGaudreau
i'm all vIRTUAL by @LiorKamrat


Comments
Post a Comment