VMware vROps - EPOps vCenter Monitoring Dashboard

This dashboard could be used by the operations team to monitor a vCenter and provide early warning on potential issues, empowering them to transition from reactive to proactive support mode. Moreover, this dashboard could be easily modified to monitor just about any supported OS and application running in a VM or even physical machine. This could include monitoring of SQL, Exchange or SharePoint servers. The possibilities are almost endless.
In this example, we will use EPOps Agent to monitor vCenter Server 5.5 running on Windows 2008 Server VM. We are also employing the standard vCenter Adapter, vCenter and MS SQL Plugins, as well as a number of other customized elements. Let's break down the dashboard's functionality.

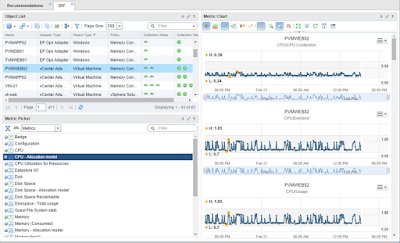
Leveraging the Health Chart widget we can display the health status of key vCenter components including services. In addition to services we can also include vSphere Host and Datastore our vCenter VM is running on. Selecting any of the objects in the Health Chart (1) will display the selected object's KPIs in the center column Sparkline Chart widget (2). So in essence, when you see the health of one of the vCenter components degrading, you can select it and immediately get the list of important KPIs associated with that object. The list of KPIs is curated via interaction file so we don't get random metrics provided by vROps. On the right side at the top is a Scoreboard widget (3) always showing the status of all key vCenter services running in the Guest OS on the VM. Each service is monitored on a one minute interval, which is more frequent than standard five minute vROps polling. Moving down the right column, we have a Heatmap widget (4) set to always show our vCenter's disk space usage. Lastly, we have a Top Alerts widget (5) showing any alerts on the currently selected object in the Health Chart widget.
I hope this post helps you find a use case for new EPOps functionality in your environment. EPOps replaces the bolt-on Hyperic solution previously bundled with vROps Advanced and Enterprise licensing and is a big step forward for VMware in bringing a consolidated monitoring solution to the virtualization and cloud market.
UPDATE (Wednesday, June 29, 2016):
Please checkout the new version of this dashboard that supports multiple vCenters including Windows and VCSA.

Enjoy!
For more information about vROps, see the following resources:
Books:
VMware vRealize Operations Managers Essentials by Matthew Steiner
Mastering vRealize Operations Manager by Scott NorrisVMware vRealize Operations Manager Capacity and Performance Management by Iwan 'e1' Rahabok
Official VMware:
VMware Professional Services
Official vROps Documentation
VMware Operations Management White Papers
Extensibility and Management Packs
Blogs:
vXpress by @Sunny_Dua
virtual red dot by @e1_ang
Virtualise Me by @auScottNorris
Elastic Sky Labs by @JAGaudreau
i'm all vIRTUAL by @LiorKamrat


Hiya,
ReplyDeleteI have endpoint agents on my vCenter server and SQL server and have added the vCenter Service to monitor along with a few others but I can't seem to pick them up in the health widget. How were you able to select your services in here? Cheers
You will have to create a Custom Group that has all related objects in it. Then you can select it in the Health Chart widget filter.
Delete